

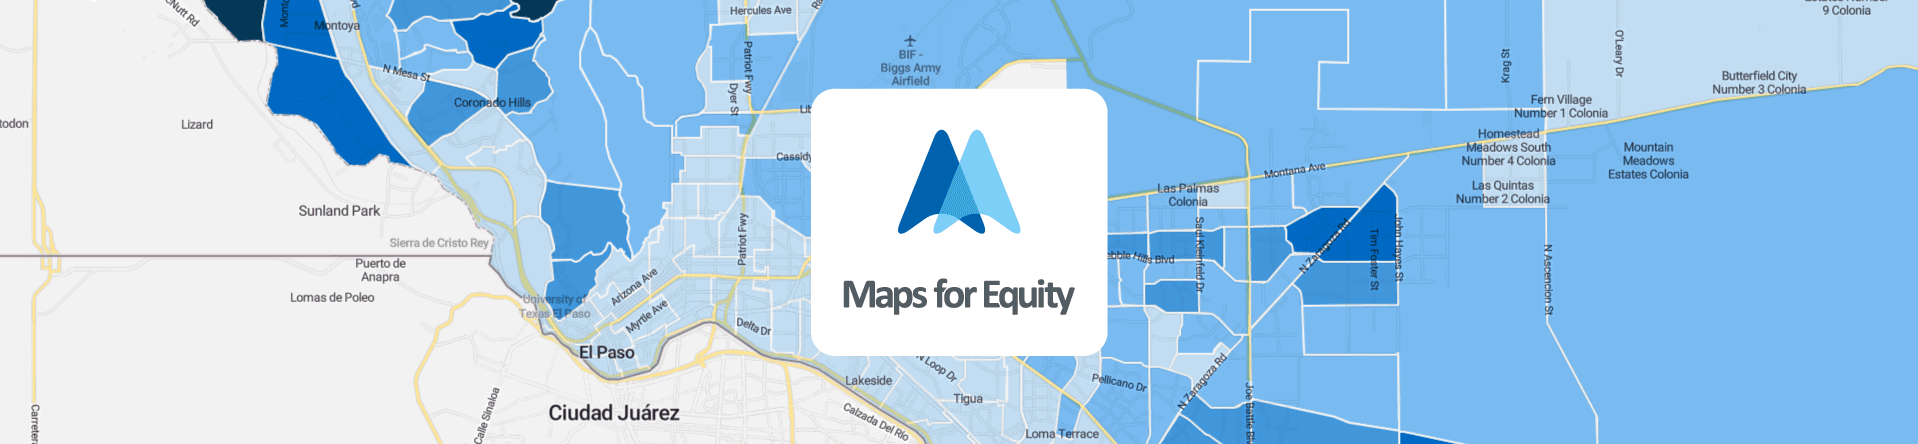
We custom-built an interactive map that visualizes data from the US Census, the CDC, the EPA, and other government agencies.
Local health, demographic, and economic data is valuable to community groups and researchers. But it's difficult to search through dozens of government websites with different interfaces to find relevant data.

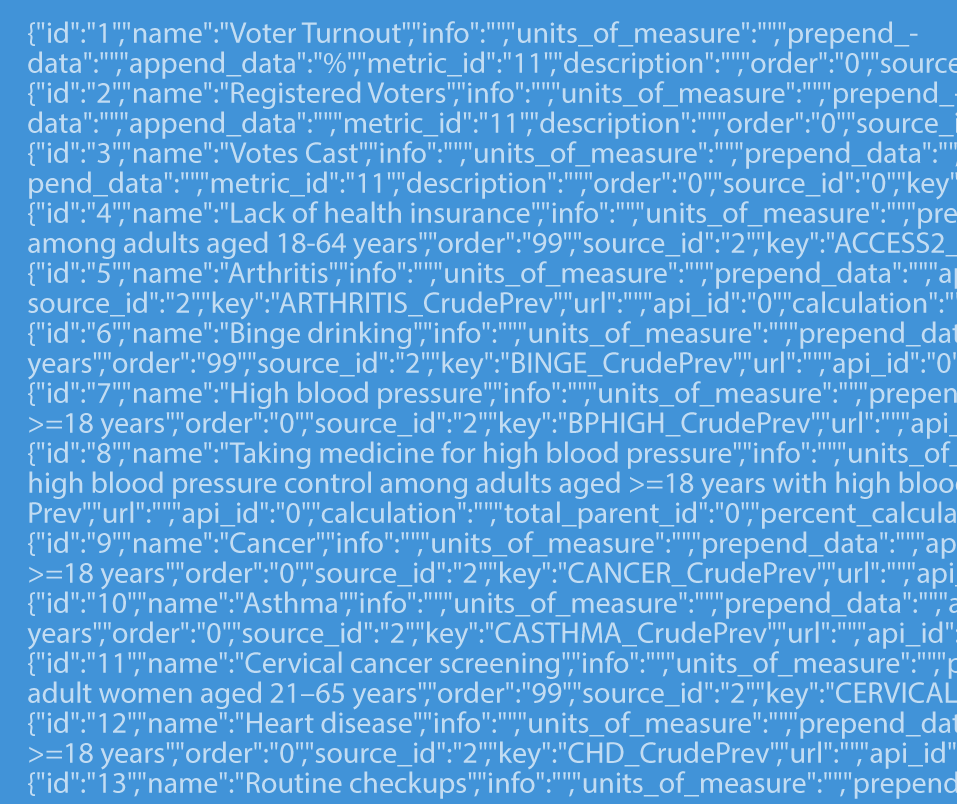
We created Maps For Equity to make data accessible and understandable with simple maps and charts. We used AI to sort through hundreds of variables, categorize them into topics, and order them by importance.

We consciously guided AI to group data into topics that reflect the well-being and environmental health of a community.
This goes beyond standard economic indicators that don't account for issues like pollution, chronic disease, and access to green spaces.
© 2026 BrainDance AI
Subscription Request Successfully placed!
Your message was sent!